One of the books that made an impression on me as I was growing up in the 1970s was C. S. Forester’s Sink the Bismarck! Although it wasn’t the most factual account of the destruction of the the great German battleship, it did spark a life-long interest in me in Second World War naval warfare.
My other great interest while I was growing up was maps. That interest I eventually turned into a satisfying career.
Ten years ago I was surfing around the Internet and came across uboat.net, a detailed and thorough site that lists all of the ships sunk by German u-boats and their locations as well as the u-boats themselves. The site is great but the focus I found to be too limiting. U-boats played a major role in the Battle of the Atlantic but did not account for all the shipping losses in that theatre. Where were the ships sunk by mines or bombs or shells? Or, for that matter, what about the rest of the war, especially the naval war in the Pacific?
I looked about the Internet and quickly realized that no such database and/or map existed. There was a rather unsatisfactory map of World War II shipwrecks produced by SeaAustralia but it was grainy and static. Clearly, if I wanted to see such a map, I would have to create it.
And so I embarked on a project of mapping all of the ships sunk during the Second World War as a result of military action (i.e. no accidental sinkings). After 8 years of research I came up with a database and an interactive map that contained over 13,000 records. Since I published this mapping application in 2020 I have continued to research the Internet and hard copy sources for the locations of the 5,000 records for which I did not have location. This has continued to yield results and I have been able to add another 800 or so locations to the map.
Take some time with the mapping application and look up your favourite ship or location. There are bound to be mistakes so let me know if you find any.
Return to this site to learn of updates and other Second World War naval warfare maps.
In the Battle of the Atlantic, Allied convoy survival depended on more than escorts and firepower—it also depended on being difficult to find. U-boats had to locate a convoy before they could attack, and one of the Allies’ most flexible defences was to adjust when and where convoys sailed. As the campaign intensified—and as intelligence, air cover, and U-boat tactics evolved—convoy routes did not remain fixed. This post asks a straightforward question: did North Atlantic convoy routing change in systematic or predictable ways as the battle unfolded?
Background
Some time ago I wrote about the Canadiana collection of World War II convoy maps and the launch of the World War II Convoy Atlas. In the seven or eight months since then, I added 368 convoy routes to the Atlas. Early on I decided to focus on the North Atlantic for two reasons: it was often the main stage in the convoy war with the U-boats, and the Canadiana collection includes a substantial run of North Atlantic route maps.
The dataset used here covers four convoy series: HX and SC (eastbound to the UK) and ON and ONS (westbound to North America). Each series is mapped from about October 1941 (the earliest routes available) through to the end of July 1943. That end date sits roughly halfway between the start of the Canadiana run and the end of the war in May 1945—an appropriate point to pause and look for spatial and temporal patterns.
Map of the route of convoy SC-122, one of the less fortunate of the North Atlantic convoys to sail. From the Canadiana collection.
Convoys were introduced shortly after the outbreak of war in 1939 as a defensive measure against U-boat attacks, and they expanded across the Atlantic as U-boats pushed farther from their European bases. The North Atlantic convoys ran between Halifax, Sydney and—later—New York City and the UK, most often to Liverpool but sometimes to Loch Ewe in the north of Scotland. They carried civilian and military supplies eastbound and returned westbound most often in ballast. From 1 November 1941 to 31 July 1943, 361 North Atlantic convoys sailed; 342 of these were mapped here. The unmapped convoys were either missing from the collection or illegible.
Number of North Atlantic Convoys arriving at destination between 1 November 1941 & 31 July 1943
Number North Atlantic Convoys Mapped
HX Series
94
94
SC Series
88
84
Eastbound Convoys Total
182
178
ON Series
166
155
ONS Series
13
9
Westbound Convoys Total
179
164
All North Atlantic Convoys
361
342
Map 1 shows all 342 mapped convoy routes that arrived between 1 November 1941 and 31 July 1943. The red line indicates the shortest route – the Great Circle route – between Cape Spear, Newfoundland, and the North West Approaches leading to Liverpool.
Map 1: The routes of 342 North Atlantic convoys between 1 November 1941 and 31 July 1943
As the map suggests, few convoys took the shortest path. Routes range from the Azores in the south to Greenland in the north, with most tracks lying north of the Great Circle. On its own, however, Map 1 doesn’t reveal clear structure. To see patterns, we need to add time.
Mapping by Time
Snapshot 1: November 1941 – March 1942
There were 89 convoys that arrived between 1 November 1941 and 15 March 1942, all of which are mapped here. Routes follow a broad, roughly 1,500 km-wide band between North America and the UK, with Halifax as the main North American port. UK arrivals and departures are split between Liverpool and Loch Ewe (see Map 2). Westbound convoys (ON, shown in blue) generally sailed to the south—or to starboard—of their eastbound counterparts (HX in red; SC in orange).
Map 2
Across these 89 convoys, 3,544 ships sailed and 3,176 (89.6%) arrived safely. Of the 368 that did not, 41 were sunk by U-boats; most of the remainder turned back—usually because of mechanical problems—or were lost to accidents or weather. Average passage time during this period was 16.3 days.
Snapshot 2: March – June 1942
By mid-March, the convoys were sailing relatively undisturbed across the Atlantic. The mapped convoy routes for this three-month period reflect that (Map 3 below). Westbound convoys (in blue) continued to sail to the south of their eastbound counterparts, the slower SC convoys (in orange) to the north of the HX convoys (in red).
Map 3
During this 3 month period, 57 North Atlantic convoys sailed with 1,971 ships, 95.3% of which arrived safely at their destination. U-boats sank 11 of these ships. The average convoy travel time dropped to 15 days.
Snapshot 3: June – September 1942
The summer of 1942 marks the start of a year in which convoy routing became increasingly dispersed. In June–September 1942 (Map 4), convoys still took relatively direct tracks that broadly followed the Great Circle route. Average passage time across all series was 14.1 days, and the safe-arrival rate (95.4%) remained high for this slice of the campaign.
Map 4
Snapshot 4: September – December 1942
From mid-September to mid-December 1942 (Map 5), routes are noticeably more dispersed than in earlier months and shift north of the Great Circle. HX and SC convoys still broadly track together, while westbound convoys appear more scattered. Travel times increased by about three days to an average of 17.4 days. The safe-arrival rate dropped to 92.9%, and U-boats sank 66 ships sailing with the North Atlantic convoys during this period.
Map 5
Snapshot 5: December 1942 – March 1943
From 15 December 1942 to 15 March 1943 (Map 6), routes appear more widely dispersed, with many convoys pushing much farther north during the crossing. Average passage time rose to 19.6 days—a 38% increase compared with June–September 1942. The safe-arrival rate fell to 86.8%, and U-boats sank 68 vessels in these convoys. No surprisingly, these were the worst months for the Allies in the Battle of the Atlantic
Map 6
Snapshot 6: March – June 1943
This dispersal continued into spring 1943, but Allied fortunes were already improving (Map 7). Routes were still spread across the North Atlantic, yet average passage time had dropped back to 17.4 days. The safe-arrival rate rose to 93.5%, while U-boats sank 55 ships during this period.
Map 7
Snapshot 7: June – July 1943
By the end of May 1943, the crisis for the North Atlantic convoys had passed. Germany lost 43 U-boats from all causes during May—22 of them in the North Atlantic—prompting a “temporary” withdrawal from the main convoy routes. From 15 June through the end of July 1943 (Map 8), no Allied ships sailing in the North Atlantic convoys were sunk as a result of U-boat action. Average passage time fell to 14.8 days and, from 22 June on, each convoy series had its own set of standard routes, “and the most suitable one, in the light of U-boat and seasonal conditions, was designated in the pre-sailing telegram.”1 The safe-arrival rate rose to 97.7%.
Map 8
Sailing Time
Measuring and comparing the length of each mapped route directly would be time-consuming, especially because many routes are not shown in full from port to port. Sailing time can serve as a useful proxy for distance. Using departure and arrival dates published on Convoyweb, I charted changes in passage time over the period. Convoys that dispersed before reaching port (all between November 1941 and August 1942) were removed from the dataset.2
From November 1941 to September 1942, average convoy passage times were between 11 and 18 days. In September and October 1942 there was a sharp jump, and from then through July 1943 averages range between about 14 and 21 days. Early in the period, the slower SC convoys were clearly distinct from the faster HX convoys. By June 1943—when North Atlantic convoys were sailing largely unbothered by U-boat attacks—that gap nearly disappeared, with all series typically taking 14–15 days to cross.
Choosing the Route
The first map in this post shows a dense tangle of tracks across the North Atlantic. It can look random at first glance, but each line reflects a deliberate routing decision. Convoys sailed with a planned course—set using the best available intelligence on U-boat and surface threats—and that plan could change at sea. Many Canadiana charts show both intended and actual tracks, with earlier routes crossed out as new information arrived. In other words, what you see on these maps is not just where convoys went, but how often they were steered away from danger in real time.3
A detail of the convoy chart for westbound ON-166 that departed Liverpool on 11 February 1943 and arrived in New York City 20 days later. The chart indicates that route planning changed multiple times. The highlighted line is the route that was taken. ON-166 lost 14 of its 55 merchant vessels to U-boats
As the war progressed, expanded air cover, intelligence and better detection—radar and direction-finding in particular—made it easier to identify where U-boats were operating. That advantage gave Allied planners more room to manoeuvre: routes could be shifted away from reported contacts, and traffic could be dispersed when concentration itself became a liability. By early summer 1943, when passage times stabilized and the U-boat threat eased, routing looked less like evasive zig-zagging and more like a return to efficiency.
If the North Atlantic battlefield had a front line, convoy routing sketched it. From spring 1942 through the end of that year, the safest water gradually migrated toward the margins of the ocean—especially to the north and the west. Later, the routes fanned out across much of the Atlantic, suggesting both a heightened threat and an Allied ability to use intelligence to pick paths through it.
Seen in sequence, these tracks are a record of adaptation rather than fixed shipping lanes. When risk was lower, routes tended to tighten toward quicker crossings. When danger increased—or when uncertainty about U-boat positions forced caution—tracks widened, shifted, and sometimes changed mid-voyage. By June–July 1943 the pattern reversed: shorter, more consistent passage times point to a convoy system no longer shaped primarily by evasion. In that sense, the geography of these routes doubles as narrative—an evolving front line traced by ships trying to get through.
You can see the route changes for yourself in this short animated map video:
Further Reading
The World War II Convoy Atlas containing the mapped routes and statistics on hundreds of convoy route.
Sunken Ships of the Second World War, an interactive map that shows the locations of over 15,000 ships that were sunk during the war.
The following edits to the Sunken Ships database were made:
1 record was edited
6 record were moved to better locations
Thanks to a lead provided by reader Thomas (thank you!) I was able to place the following 34 ships on the map. These were all sunk in August 1944, either by Allied bombs or at the hands of the retreating Germans who sought to make the port of Marseille unusable.
Convoy HX-229 departed New York City on 8 March 1943 with 40 merchant vessels and arrived in the UK 15 days later with only 26. One ship returned to New York City early on in the voyage and the other 13 were lost along the way, sunk by German U-boats. Along with the slower SC-122 convoy that left New York City 3 days earlier and lost 9 of its 51 ships, HX-229’s passage across the North Atlantic marked a low point in Allied fortunes in the North Atlantic battleground. Books (1, 2) have been written on the battles surrounding these two convoys and maps of their routes are easy to find online, including ones that are incorrect. Location and timing is crucial for the success of participants in any battle and providing maps showing these locations and their times is helpful in understanding how the battles of convoys HX-229 and SC-122 unfolded.
An Allied convoy near Iceland, 1942
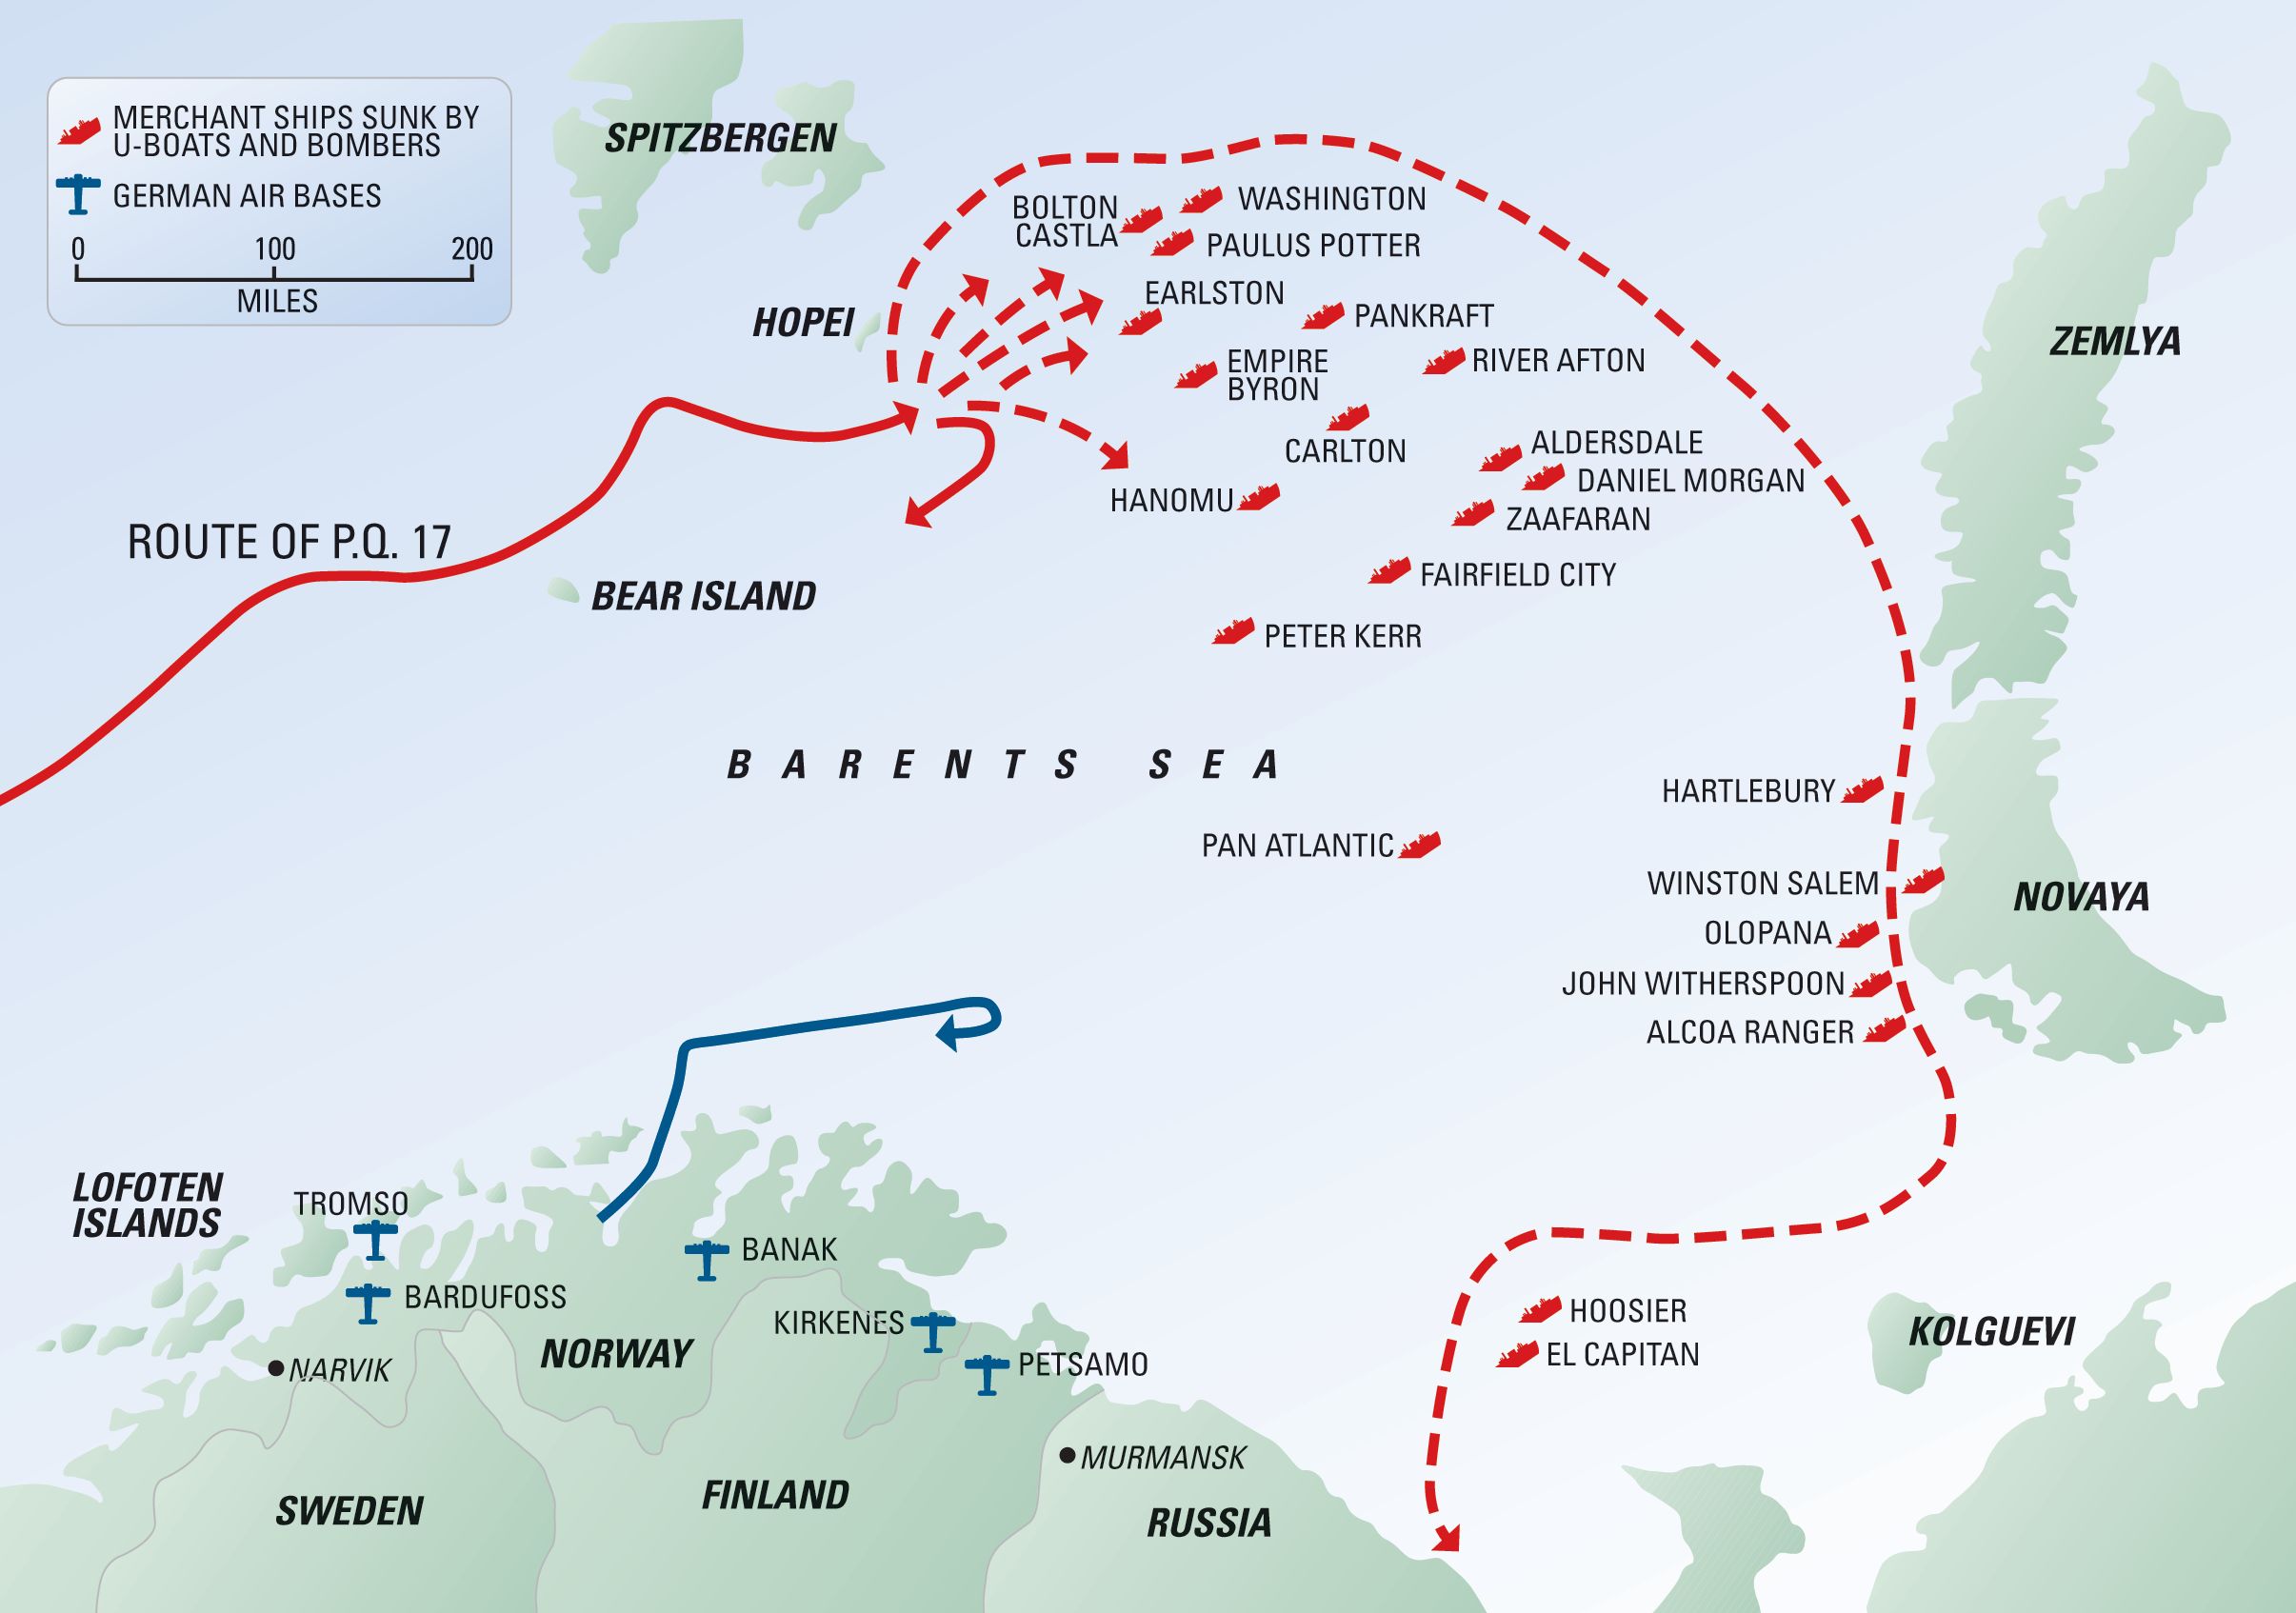
Other convoys that lost multiple ships have also been mapped and described. Convoy PQ-17, for instance, sailed for the Russian port of Arkhangelesk from Iceland in June/July 1942, lost 23 of its 35 merchant vessels to German U-boats and aircraft, and has also been written about (1, 2) and mapped (1, 2). But the majority of convoys have passed into obscurity.
This is not surprising as there were over 18,000 Allied convoys during the Second World War. Most of these convoys sailed undisturbed and arrived at their destinations unscathed. Of the 364 convoys that sailed as part of the HX series of convoys between September 1939 and May 1945, for instance, 299 did not lose any ship to Axis forces. In fact, close to 96% of the ships that sailed in these convoys arrived at their destination. Most of the ships that did not make the trip returned to the port of their origin due to mechanical or other issues. Less than 1% – 179 – of the 18,566 ships that sailed as part of an HX convoy were sunk due to enemy action. (Numbers have been compiled from Convoyweb).
Maps for most convoys are difficult to find. This is understandable since most convoys arrived safely at their destinations without incident. But, though the maps of single convoys that had no losses might be somewhat mundane and dull to look at, collectively the alignment of their routes may tell a story.
The World War II Convoy Atlasis a collection of convoy maps in an interactive dashboard. Included in the Atlas so far are the routes of 100 convoys. Aside from the maps, the dashboard includes summary information on each convoy and a listing of any ships that were sunk along its route. Though there were 18,461 Allied convoys that sailed during World War II I don’t expect to be mapping them all. But do expect to see the number of convoys mapped increase over the next few months.
Included on the map are the following convoy routes:
Much of the mapping information that is included in the Atlas comes from a single source I have recently discovered: the Royal Canadian Navy: Convoy Reports of Proceedings, 1939-1945. This collection includes messages between Canadian naval headquarters and the convoy commanders, convoy reports and maps on which both the planned and actual route of the convoy were plotted. This collection of wartime documents was captured on microfilm, after which the originals were destroyed. Library and Archives Canada has since digitized and published the microfilm.
The route map of Convoy HX-229. This sheet is the typical North Atlantic sheet used to record the trans-Atlantic convoys, probably has a scale of 1:8,000,000 (the numbers are difficult to read) and probably is about 107 cm (42 in) wide by 84 cm (33 in) high. Source: Library & Archives Canada
The collection contains over 223,000 images in 42 reels. There is no index to the images and the images are not searchable so finding specific content in the collection can be a challenge. The convoy maps, conveniently, appear in last 5 reels of the collection (C-5542 to C-5546). A complete list of the convoys mapped is provided the in table at the end of this post. The maps were published by the Hydrographic and Map Service in the Canadian government’s Department of Mines and Resources and were used by both merchant and naval vessels. The most common maps in the collection is one depicting the North Atlantic (example in the figure above) and one that depicts Atlantic Canada (see figure below). Captains and crewmembers would plot the expected route and the actual route, with dates and times. Sometimes additional notes were recorded to indicate events.
The route map of Convoy BW-94. This is the standard Gulf of St. Lawrence map that was used to plot the route of coastal convoys in and around Atlantic Canada and Newfoundland. The scale and size of this map is unknown. Source: Library and Archives Canada.
Putting the Atlas Together
Creating the convoy data required the published maps in the Collection to be imported and geo-referenced before they could be digitized. Summary information compiled from data published on ConvoyWeb was added to the appropriate record. The Sunken Ships database was added to a map. Since it shares a common data field with the convoy data, both could easily be incorporated into an interactive dashboard. This could easily have been done in one dashboard – an initially was.
But I split up the Atlas into 3 pages and, much like a paper atlas, each page focuses on one area or theatre of operations. Each map has its own map projection – one that is more suitable to the area of interest than the usual Web Mercator. This was especially true for the Arctic convoy map where east – west distances are grossly distorted in Web Mercator. Because the content of my map was fairly simple to begin with and because I didn’t need the wealth of information that comes with a standard basemap, I could dispense with the usual Web Mercator projection.
Instead I cached one single layer – my bathymetry data (from Natural Earth) that happened to draw faster in cached format anyway – in the projection I selected for the map. Because I had three different maps, each with a different projection, I had to do this 3 times. The caching time is quick and the storage required to host the cache is minimal so this was not onerous.
The maps for each theatre were placed in their own dashboards and each dashboard was given its own page within an ArcGIS Online Experience Builder app. As an introduction, a StoryMap was created and placed on the first page. Because of the flexibility of the Experience Builder app, it can be easily expanded to include additional content and enables a stable url regardless of the content changes within it.
Not a good day for HX-229
Index to the Library & Archives Canada convoy map collection


